Analysis of China's Power Development and Reform Situation (2022)
Original Wang Xuechen Cui Xiaoli China Energy Media Research Institute 2022-03-30 20:22
Core Tips
In 2021, the power industry continued the green and low-carbon development trend, and the construction of a new-type power system took new steps. In 2021, the proportion of installed non-fossil energy capacity exceeded that of coal-fired power for the first time, and the installed renewable energy capacity exceeded 1 billion kilowatts. The annual power generation increased by 9.8%, the annual new energy power generation exceeded 1 trillion kilowatt-hours for the first time, and the renewable energy power generation reached 2.48 trillion kilowatt-hours, accounting for 29.8% of the total social electricity consumption. The annual power consumption achieved double-digit growth. Affected by multiple factors such as economic recovery, weather, and rising coal prices, the overall power supply and demand was tight. Power reform and innovation effectively stimulated the impetus for high-quality development, with the annual market-oriented transaction volume reaching about 3.5 trillion kilowatt-hours. Combined with the power operation in the past decade, this report analyzes China's power supply and demand situation, operation characteristics, reform progress, development direction and other contents from multiple perspectives for reference.
Analysis of China's Power Development and Reform Situation (2022)
Wang Xuechen Cui Xiaoli
(Energy Security New Strategy Research Institute)
2021 is a milestone year in the history of the Party and the country. Faced with the once-in-a-century changes and the global pandemic, China has maintained a global leading position in economic development and pandemic prevention and control, comprehensively deepened reform and opening up, took new steps in building a new development pattern, and achieved new results in high-quality development. In 2021, China's gross domestic product (GDP) grew by 8.1% year-on-year, with a two-year average growth of 5.1%; the economic scale exceeded 110 trillion yuan, ranking as the world's second largest economy, and China's per capita GDP reached 80,976 yuan (equivalent to 12,551 US dollars at the annual average exchange rate), exceeding the world's per capita GDP level.
In 2021, the growth rate of power consumption achieved double-digit growth, and the power installed structure continued the green and low-carbon development trend. The power production and supply capacity was improved. By the end of 2021, the national installed power generation capacity reached 2.38 billion kilowatts, an increase of 7.9% over the end of the previous year. The green transformation of power generation installed capacity continued to advance. The proportion of installed non-fossil energy capacity exceeded that of coal-fired power for the first time, and the installed renewable energy capacity exceeded 1 billion kilowatts. The installed capacity of grid-connected wind power has ranked first in the world for 12 consecutive years, and the installed capacity of grid-connected photovoltaic power generation has ranked first in the world for 7 consecutive years. New progress has been made in clean energy consumption, and the construction of a new-type power system has taken new steps. In 2021, China's power generation reached 8,376.8 billion kilowatt-hours, an increase of 9.8%, and the annual new energy power generation exceeded 1 trillion kilowatt-hours for the first time. Power reform and innovation effectively stimulated the impetus for high-quality development, with the annual market-oriented transaction volume reaching about 3.5 trillion kilowatt-hours, and the construction of the auxiliary service market continued to deepen.
I.Power Consumption Achieves Double-Digit Growth with Optimizing Structure
(1)Total Social Electricity Consumption Increased by 10.3% Year-on-Year
In 2021, China's power consumption rebounded sharply. According to the data of China Electricity Council (CEC), in 2021, the total social electricity consumption reached 8,312.8 billion kilowatt-hours, a year-on-year increase of 10.3%, and an increase of 14.7% over the same period in 2019. Affected by factors such as the overall recovery of the economy, the boost of foreign trade exports, and the low base effect of electricity consumption growth caused by the COVID-19 pandemic, power consumption rebounded sharply.
The growth rate of electricity consumption in 2021 reached a new high in the past decade, slightly lower than 14.8% in 2010 and 12.0% in 2011.
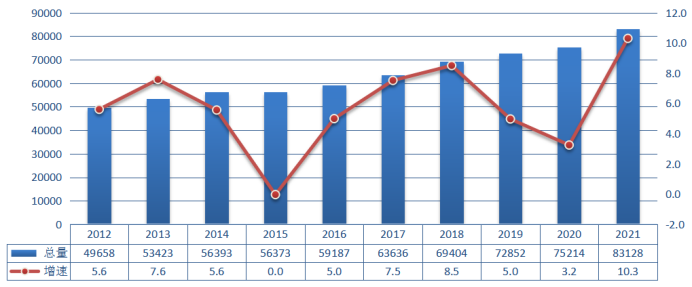
Figure 1 National Total Social Electricity Consumption and Growth Rate from 2012 to 2021 (Unit: Billion Kilowatt-Hours, %)
Note: The 2021 data comes from the CEC Express Report, others from the CEC's annual power industry statistics, and the growth rates are calculated. The same applies hereinafter unless otherwise specified.
(2)Quarterly Electricity Consumption Growth Rate Declined Quarter by Quarter
In 2021, the total social electricity consumption in each quarter maintained a steady and rapid growth. The total social electricity consumption in the first, second, third and fourth quarters increased by 21.2%, 11.8%, 7.6% and 3.3% year-on-year respectively. In 2021, the two-year average growth of total social electricity consumption was 7.1%, and the two-year average growth rates of each quarter were 7.0%, 8.2%, 7.1% and 6.4% respectively.
Driven by the sustained and stable recovery of the economy and the growth of electricity consumption in the secondary industry, the total social electricity consumption in the first quarter grew rapidly, driving the annual electricity consumption to increase by 4.5 percentage points year-on-year, an increase of 14.4% over the same period in 2019. Affected by policies such as energy consumption dual control, resolutely curbing the blind development of "high-energy-consuming and high-emission" projects, and the rising base in the same period, the quarterly electricity consumption growth rate showed a "high front and low back" trend. By comparison, it can be seen that from the perspective of the two-year average growth rate of each quarter in 2021, the growth rate was slightly higher than that in 2019, between 2018 and 2019.
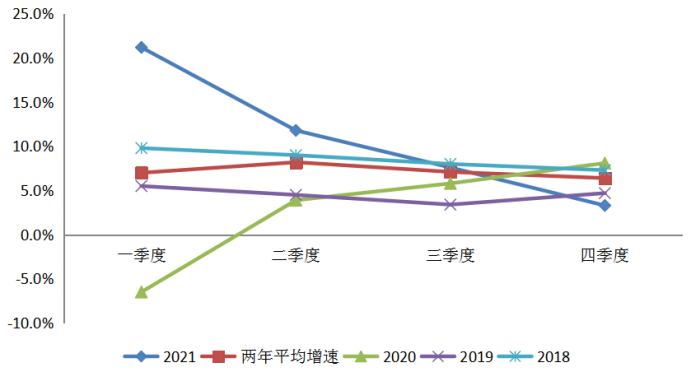
Figure 2 Quarterly Growth Rate of National Total Social Electricity Consumption from 2018 to 2021 (Unit: %)
(3)Policies to Strictly Control "High-Energy-Consuming and High-Emission" Industries and the Pandemic Have Significant Impacts on Industrial Electricity Consumption Growth
In 2021, the electricity consumption of the primary industry and the tertiary industry achieved double-digit growth. The electricity consumption of the primary industry was 102.3 billion kilowatt-hours, a year-on-year increase of 16.4%, with a two-year average growth of 14.6%; the electricity consumption of the secondary industry was 5,613.1 billion kilowatt-hours, a year-on-year increase of 9.1%, with a two-year average growth of 6.4%; the electricity consumption of the tertiary industry was 1,423.1 billion kilowatt-hours, a year-on-year increase of 17.8%, with a two-year average growth of 9.5%; the electricity consumption of urban and rural residents was 1,174.3 billion kilowatt-hours, a year-on-year increase of 7.3%, with a two-year average growth of 7.0%.
In the first quarter, the secondary industry's electricity consumption became the main driving force for the growth of total social electricity consumption, with a year-on-year increase of 24.1% and an increase of 15.4% over the same period in 2019, contributing 72.8% to the growth of total social electricity consumption; the tertiary industry's electricity consumption rebounded significantly, with the growth rate increasing month by month, a cumulative growth of 28.2%, a sharp increase of 16.5% over the same period in 2019; the primary industry's electricity consumption maintained rapid growth, with a growth rate of 26.4%, an increase of 31.4% over the same period in 2019.
Table 1 Electricity Consumption by Industry from 2012 to 2021 (Unit: Billion Kilowatt-Hours)
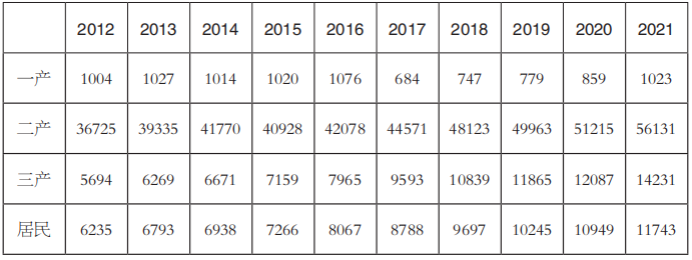
Note: In March 2018, the Notice of the National Bureau of Statistics on Revising the Regulations on the Classification of Three Industries (2012) clearly adjusted the "agricultural, forestry, animal husbandry and fishery service industry" to the tertiary industry and renamed it "agricultural, forestry, animal husbandry and fishery professional and auxiliary activities". The power industry has carried out industry statistics in accordance with the latest standards. To ensure data comparability, the data after 2017 have been reclassified according to the new standards.
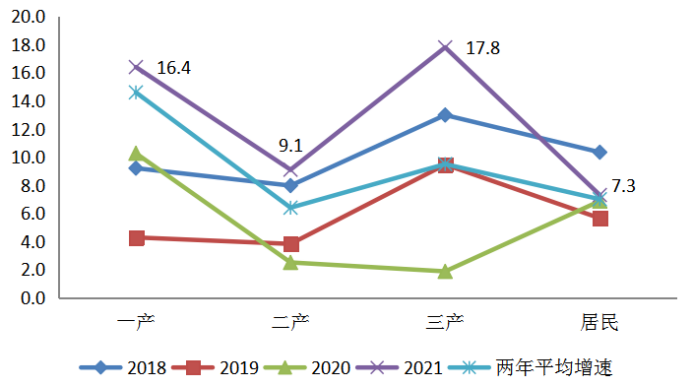
Figure 3 Growth Rate of Electricity Consumption by Industry from 2018 to 2021 (Unit: %)
Entering the second quarter, the electricity consumption growth rate of each industry declined compared with the first quarter, but the electricity consumption of the primary industry still maintained a steady and substantial growth, and the growth rate of the tertiary industry's electricity consumption rebounded to the level of the same period in 2019. Although the electricity consumption growth rate of high-tech and equipment manufacturing industries was significantly higher than the average level of the manufacturing industry in the same period, due to the gradual implementation of the national policy to resolutely curb the blind development of "high-energy-consuming and high-emission" projects, the growth rate of the four major high-energy-consuming industries gradually declined, directly affecting the growth rate of the secondary industry in the third and fourth quarters. Coupled with the impact of sporadic COVID-19 cases in some areas, the growth rate of the tertiary industry's electricity consumption in the third and fourth quarters fell back.
From the two-year average growth rate in 2021, only the growth rate of the primary industry's electricity consumption was higher than the levels in 2018 and 2019, and the growth rates of the secondary industry, tertiary industry and residential electricity consumption were between 2018 and 2019.
(4)Power Consumption Structure Continues to Optimize, with the Proportion of Secondary Industry Electricity Consumption Decreasing Year by Year
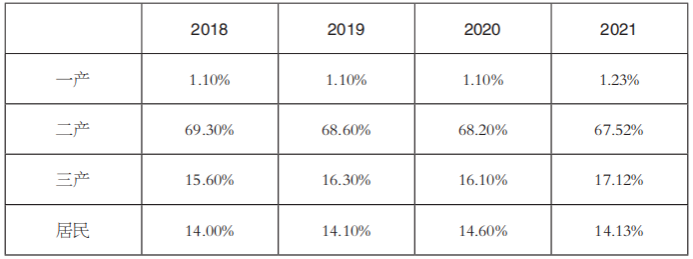
While the total social electricity consumption maintained steady growth, the power consumption structure was increasingly optimized. The proportion of electricity consumption in the secondary industry gradually shrank, and the proportions of the primary industry and the tertiary industry expanded slightly. With the continuous improvement of rural electricity consumption conditions, the further rapid development of high-tech and equipment manufacturing, charging and swapping services, emerging service industries, and the improvement of living standards of urban and rural residents, the electricity consumption structure will further tilt towards the primary and tertiary industries.
Table 2 National Total Social Electricity Consumption Structure from 2018 to 2021
II.Power Installed Capacity Continues to Rise, Proportion of Non-Fossil Energy Exceeds Coal-Fired Power for the First Time
(1)National Power Installed Capacity Approaches 2.4 Billion Kilowatts, Up 7.9% Year-on-Year
By the end of 2021, the national installed power generation capacity was about 2.38 billion kilowatts, a year-on-year increase of 7.9%, with the growth rate shrinking by 1.7 percentage points.
In the past decade, China's installed power generation capacity has continued to grow. From 2012 to 2021, China's cumulative installed power generation capacity increased from 1.15 billion kilowatts to 2.38 billion kilowatts. The installed capacity growth rate in the past decade showed a fluctuating trend. From 2015 to 2019, the installed capacity growth rate showed a downward trend, and rose sharply in 2020, mainly due to the record high new installed capacity of new energy such as wind power and solar power.
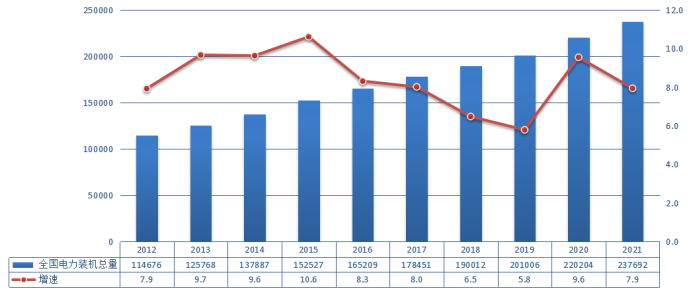
Figure 4 National Power Installed Capacity and Growth Rate from 2012 to 2021 (Unit: 10,000 Kilowatts, %)
(2)Proportion of Non-Fossil Energy Installed Capacity Exceeds Coal-Fired Power for the First Time
The green transformation of power generation installed capacity continued to advance, and the installed renewable energy capacity exceeded 1 billion kilowatts. In 2021, the national full-caliber thermal power installed capacity was 1.30 billion kilowatts, of which coal-fired power was 1.11 billion kilowatts, a year-on-year increase of 2.8%, accounting for 46.7% of the total installed power generation capacity, a year-on-year decrease of 2.3 percentage points. The installed capacity of hydropower, wind power and photovoltaic power generation all exceeded 30 million kilowatts. The installed capacity of hydropower was 390 million kilowatts (350 million kilowatts of conventional hydropower and 36.39 million kilowatts of pumped storage); wind power was 330 million kilowatts (300 million kilowatts of onshore wind power and 26.39 million kilowatts of offshore wind power); solar power generation was 310 million kilowatts (200 million kilowatts of centralized, 110 million kilowatts of distributed and 570,000 kilowatts of photothermal). The installed capacity of grid-connected wind power has ranked first in the world for 12 consecutive years, the installed capacity of grid-connected photovoltaic power generation has ranked first in the world for 7 consecutive years, and the installed capacity of offshore wind power has jumped to the first in the world. Nuclear power was 53.26 million kilowatts. Biomass power generation was 37.98 million kilowatts.
Table 3 National Power Installed Capacity Structure from 2012 to 2021 (Unit: 10,000 Kilowatts)
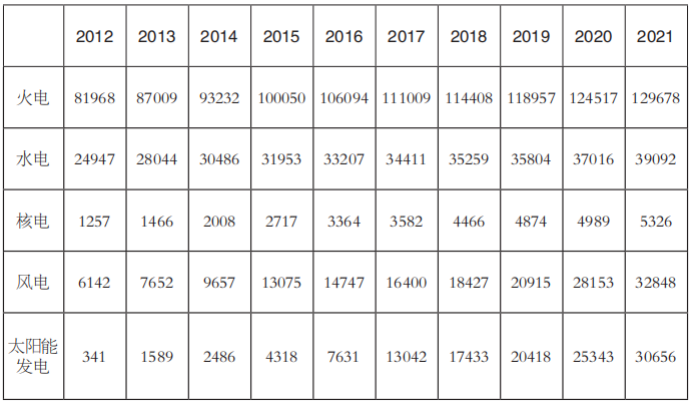
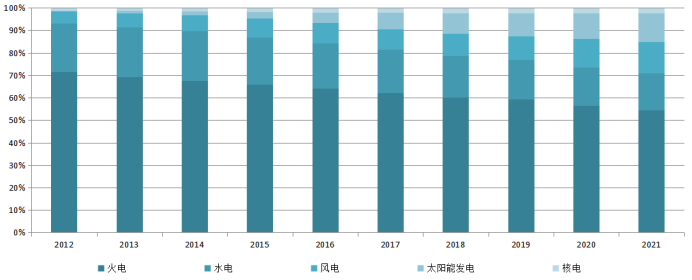
Figure 5 National Power Installed Capacity Structure from 2012 to 2021
The installed capacity of non-fossil energy power generation exceeded that of coal-fired power for the first time. From the historical data of the past decade, the proportion of non-fossil energy installed capacity has increased significantly. In 2021, the national full-caliber non-fossil energy installed capacity reached 1.12 billion kilowatts, a year-on-year increase of 13.4%, accounting for 47.0% of the total installed power generation capacity, exceeding the scale of coal-fired power installed capacity for the first time. In 2021, the cumulative installed capacity of renewable energy power generation reached 1.03 billion kilowatts, doubling compared with the end of 2015, accounting for 43.2% of the national total installed power generation capacity, an increase of 10.9 percentage points over the end of 2015.
From the perspective of installed capacity growth rate, in 2021, the installed capacity of wind power and solar power generation grew sharply at a rate of more than 15%, solar power generation increased by 20.9% year-on-year, and wind power increased by 16.6% year-on-year. Nuclear power increased by 6.8% year-on-year. Hydropower increased by 5.6% year-on-year. Thermal power increased by 4.1% year-on-year, of which coal-fired power increased by 2.8% year-on-year, and its proportion in the total installed power generation capacity decreased by 2.3 percentage points year-on-year.
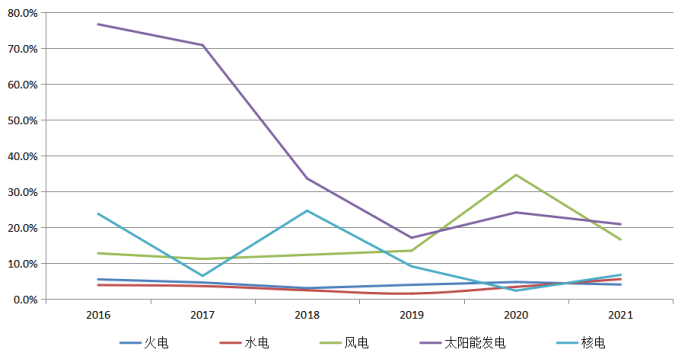
Figure 6 Growth Rate of Installed Thermal, Hydropower, Wind, Solar and Nuclear Power from 2016 to 2021
(3)Newly Added Non-Fossil Energy Power Installed Capacity Accounts for Over 70% of the National Total
In 2021, the national newly added installed power generation capacity was 176.29 million kilowatts. Among them, the newly added installed thermal power capacity was 46.28 million kilowatts, the newly installed grid-connected hydropower and wind power capacity were 23.49 million kilowatts and 47.57 million kilowatts respectively, nuclear power was 3.4 million kilowatts, solar power generation was 54.93 million kilowatts, and biomass power was 8.08 million kilowatts. The newly added installed capacity of non-fossil energy power generation was 138.09 million kilowatts, accounting for 78.3% of the total newly added installed power generation capacity, an increase of 5.2 percentage points year-on-year. The newly added installed renewable energy capacity was 134 million kilowatts, accounting for 76.1% of the national newly added installed power generation capacity.
The total scale of newly added installed power generation capacity has exceeded 100 million kilowatts for nine consecutive years, and 2020 was the highest level over the years. Affected